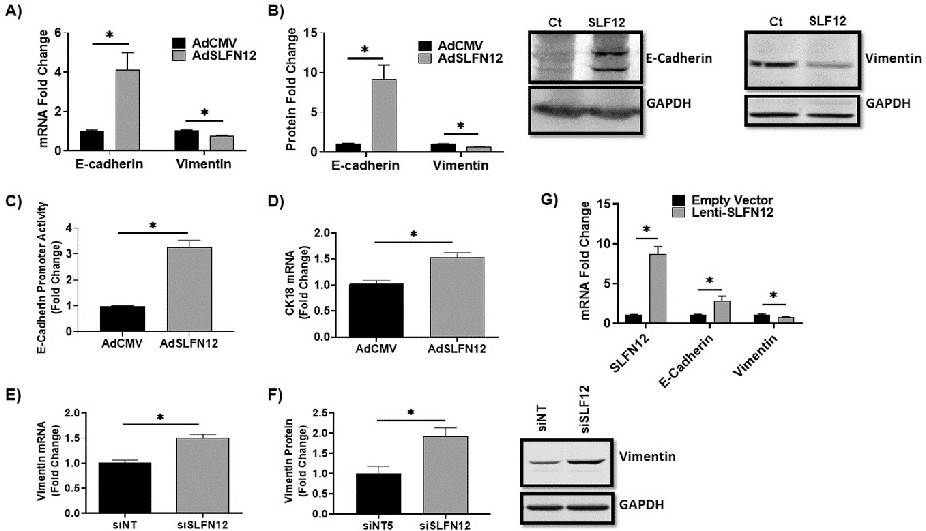
Fig. 3. Schlafen12 induces TNBC cell differentiation. A) mRNA analysis by SYBR Green qPCR of E-cadherin (n=27) and Vimentin (n=12) and B) protein levels of E-cadherin (n=17) and Vimentin (n=6) analyzed by western blot with representative blot images in MDA-MB-231 cells 72 hours after AdSLFN12 or AdCMV treatment (RPLP0, qPCR reference gene, GAPDH served as a reference protein; data normalized to AdCMV group,*p<0.05). C) Luciferase activity of E-cadherin promoter in MDA-MB-231 cells 72 hours after treatment with AdSLFN12 or AdCMV normalized to Nluc/TK Vector (n=6, *p<0.05). D) SYBR Green qPCR analysis of CK-18 or mRNA levels in MDA-MB-231 cells 72 hours after AdSLFN12 or AdCMV treatment (RPLP0 used as a reference gene), data normalized to AdCMV group (n=9, *p<0.05). E) Primer-probe qPCR analysis of vimentin mRNA levels (n=9) and F) Western blot analysis with representative blot image of vimentin protein levels (n=6) in MDA-MB-231 cells 72 hours after treatment with either siSLFN12 or non-targeting sequence (siNT5) as a control (HPRT served as a reference gene, GAPDH used as a reference protein, data normalized to siNT group, *p<0.05). G) MDA-MB-231 clones with stable SLFN12 expression generated using lentiviral vector transfection with blasticidin selection showing E-cadherin (n=11) and vimentin (n=7) mRNA levels analyzed by Primer-probe RT-qPCR. (HPRT used as a reference gene); data normalized to AdCMV group (*p<0.05). All error bars shown represent standard error of mean.